
Inside ZoneReporting: Deep insights for better supply chain management


The right reports are critical for supply chain professionals who are tasked with managing stock levels, analyzing lead and cycle times, improving vendor performance, and ensuring product is available to meet sales commitments. That’s where several of the report packages inside ZoneReporting are creating new opportunities for retailers, e-commerce companies, distributors, manufacturers and virtually any business that moves, stores and sells physical goods.
ZoneReporting is fueled by data that’s extracted from Oracle's NetSuite financial software and imported into PowerBI. When this data is combined with inventory, CRM and other data, the result is a visual, 360-degree view of the dynamics that impact the supply chain ecosystem, along with actionable insights that can accelerate and improve decision making. Here’s a look at a few of the supply chain reports we provide using sample data for a fictitious company, which we can call ABC Company. While the data is simulated, it reflects real-world situations we have encountered with our customers.
Enhancing inventory management
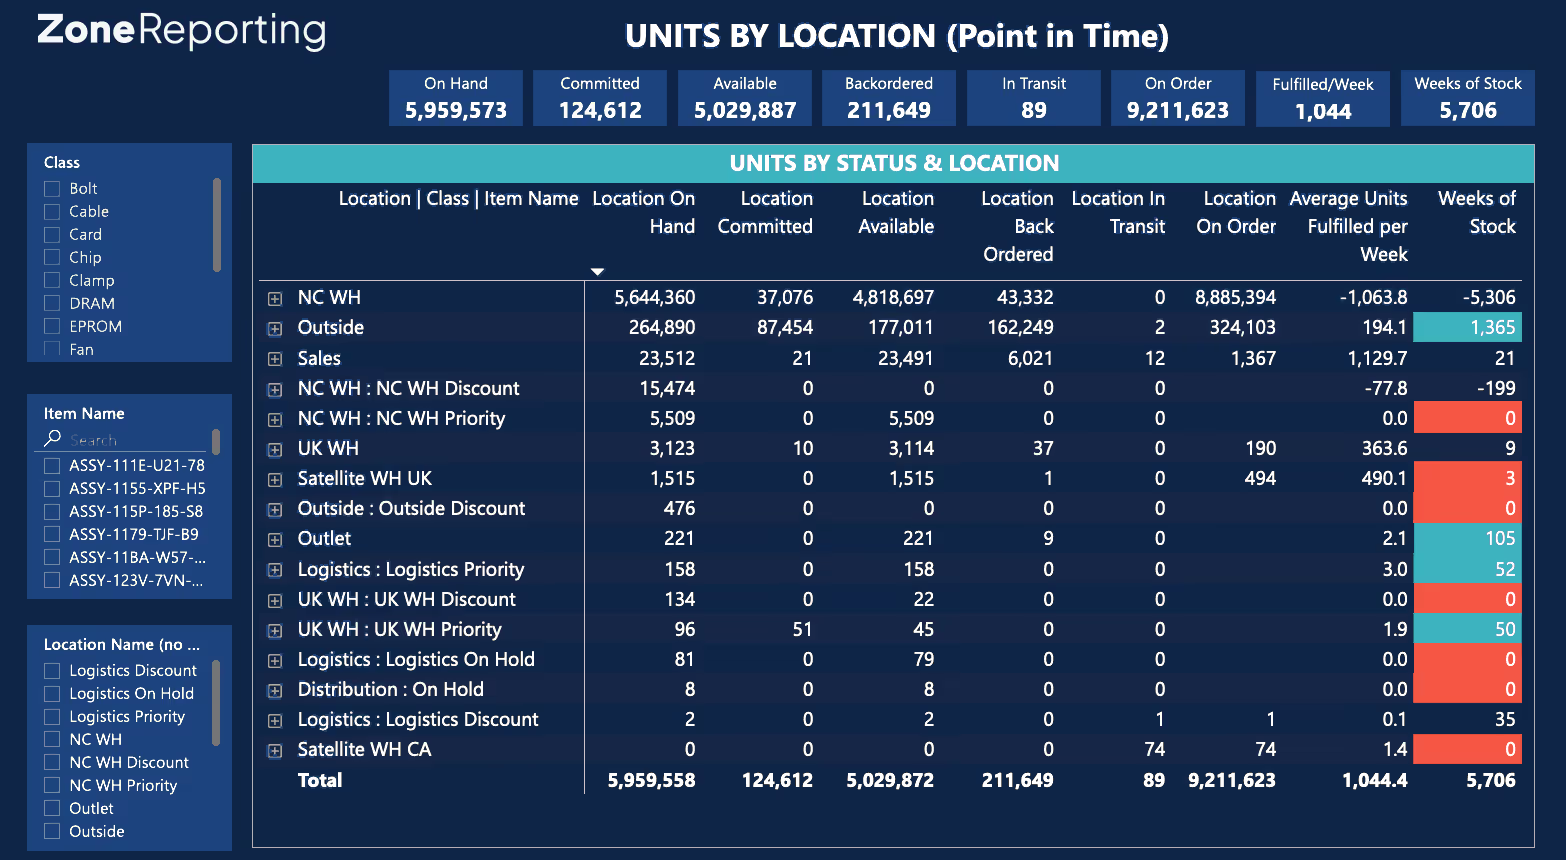
For supply chain managers, maintaining optimal inventory levels is crucial. That’s why we created a set of reports that offer a clear and detailed picture of stock levels across different locations and product categories. In the report below, we’re showing units by location for all ABC Company’s facilities. It details the number of units on hand for this location, along with the number committed, back ordered, in transit and on order. It also shows how many weeks of stock are available in this warehouse based on recent demand history.
Using ZoneReporting, managers can also dig deeply into how inventory is impacting cash flow and find out which locations, classes or items are driving key ratios such as turnover, turn/earn index and inventory to sales KPIs. For example, ZoneReporting can show inventory value by location, item type, inventory type and class.

In this report, we can see a steady increase in the value of inventory in stock at the NC warehouse. A deeper look shows that finished goods within the “chip” class are the primary driver for this increase. Drilling down into the financials for this location reveals that the increasing stock levels may be the root cause of its recent decrease in turnover rates, gross margin return on investment (GMROI) and turn/earn index.
Understanding lead times and cycle times
Accurate lead time and cycle time data are essential for effective supply chain planning. ZoneReporting offers advanced analytics that provide insights on every link in the supply chain, including historical trends in purchase, manufacturing, and transfer lead times. By understanding these metrics, supply chain managers can identify bottlenecks, improve supplier reliability and set realistic lead time expectations.

This report provides a view of overall supply chain cycle time, which combines data for supplier purchase order cycle times with the company’s internal processing time for sales orders. This report shows a steady decrease in the average supply chain cycle time, but a deeper analysis of purchase orders and sales orders can reveal opportunities for improvement.
Correlating purchase order and sales order trends
ZoneReporting excels at bringing multiple data sets together in unified, easy-to-read dashboards that yield meaningful business insights. For supply chain professionals, one of the most useful reports depicts the percentage of purchase orders (POs) and sales orders (SOs) that are delivered on time and in full. By viewing this data for POs and SOs together in one report, businesses can compare their own ability to fulfill customer orders to that of their suppliers.

This report provides a quick way for businesses to determine when supplier performance is impacting their ability to deliver their own orders. Here, we can see that the percentage of their own SOs that are being delivered on time and in full has begun trending downward, which correlates with a recent drop in the percentage of vendor PO lines that are being delivered on time and in full. This is an opportunity for the business to further investigate the availability of inventory and the performance of their suppliers.
Understanding supplier performance
A deep understanding of vendor performance and item-specific data can help businesses make supply chain decisions that balance timely order delivery with sound financial planning. Below, we can see an item analysis report, which displays KPIs and trends for all vendors and products. It allows supply chain professionals to view inventory levels, average lead times and cost per unit, as well as sell-through rates and stockout frequencies.

This data can be filtered by location, class or item, allowing detailed investigations wherever they’re needed. For example, a purchasing manager who wants to know why the PO percentage delivered on time and in full is dropping may want to look at the vendor analysis report to learn more.

This report offers a 360-degree view of each supplier, showing KPIs for all vendors and purchasing activity. It also provides the ability to drill down into data for specific vendors to review their purchasing patterns and performance metrics. In this view, we can click on the fictitious vendor Stephenson Custom to launch a detailed vendor report.

The drill down data for Stephenson Custom reveals that this supplier has an average lead time of 224 days for one of the cards they supply to the North Carolina warehouse. This may help explain the recent drop in PO delivery percentage on time and in full. Using this information, the supply chain manager may decide that it’s time to increase the lead time for orders with this vendor or find another source for this item.
Actionable insights for supply chain excellence
ZoneReporting’s pre-built report packages give supply chain professionals the deep insights and granular details they need to make informed decisions. Whether they’re used to identify trends that impact cash flow, optimize inventory levels, manage vendor relationships or investigate potential issues, these reports can make a significant difference for businesses that rely on a fully optimized supply chain.
Would you like to see how ZoneReporting can help your business unlock the full potential of its supply chain operations? Try the self-guided product tour or book a personalized demo with one of our experts.


Get a Personalized Demo Today
Start a conversation with an expert who asks thoughtful questions and shows you how Zone & Co can solve your unique problem.